Reactagles in GBPJPY
Drawing Reactangle in GJ
I always draw rectangles based on the body on candlesticks. When the market touches the previous support or resistance and forms a tweezer top or bottom, I draw the rectangle around the larger body of the tweezer.
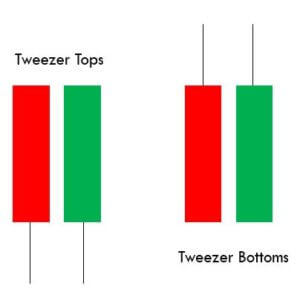
Fig1.1- Tweezer Top and Bottom
When the market revisits a previous zone, there is a high probability that it is just retesting the zone, which serves as a good indicator of a potential reversal. I usually take trades when the market retests the tweezer.
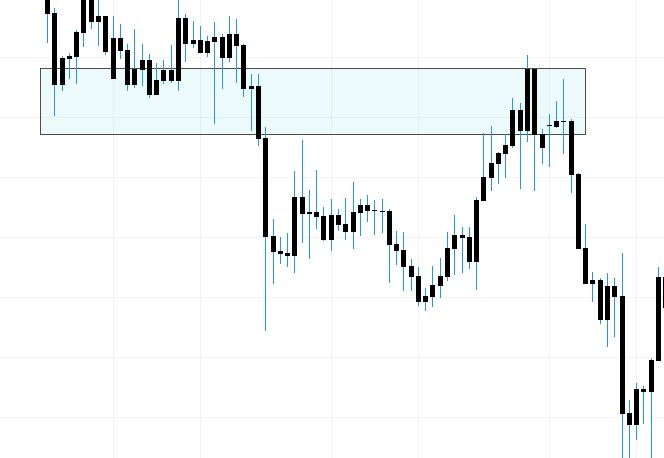
Fig1.2- 4h chart Retesting previous zone
Caution- The thing with GJ is that most of the time, it retraces to test the zone before reversing. However, always keep the direction of the trend in mind when trading on the 1-hour chart or above. In the Fig 1.3, the market is bullish, so I avoided taking a short position. And focus more on taking long position.
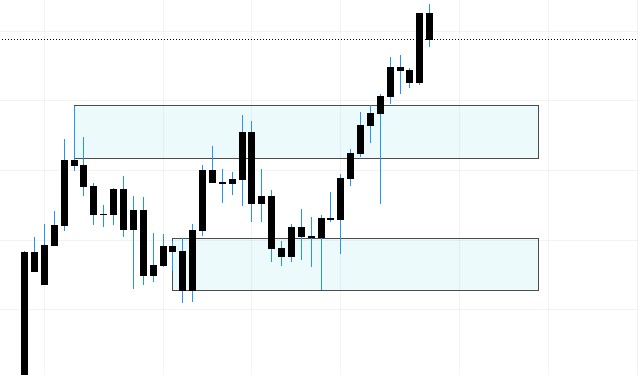
Fig1.3- 4h chart Box