Reactangle in USDCAD
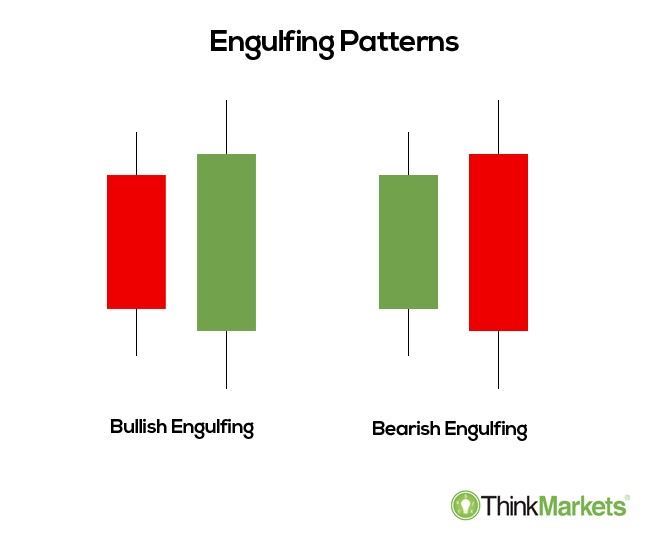
Fig2.1- Bearish and Bullish Engulfing
A big, powerful candlestick or enguffing candlestick in USDCAD is like your best friend in trading. If you spot one near a resistance or supporting zone, just draw a line on the big part of that candle. It's an easy way to figure out important levels for making smart decisions about where prices might go.
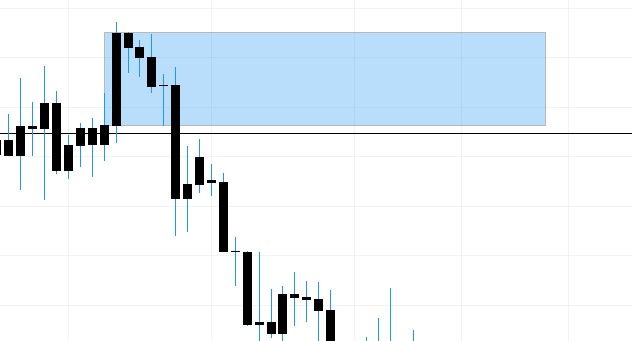
Fig2.1- USDCAD resistance zone
Sidways
Sometimes, USDCAD gets stuck in resistance or support zones. The candlesticks start to get smaller, and the volume drops. This is a crucial time to keep a close eye on the market. It's a bit like the calmness before a storm. When the market experiences high volume again, it's likely to explode with activity. Stay alert during these quiet phases
Here are some examples:
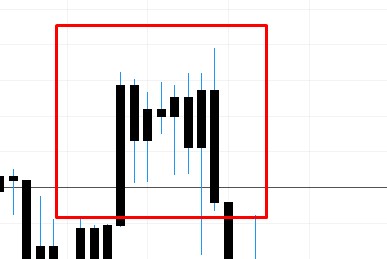
Fig2.1- USDCAD resistance zone
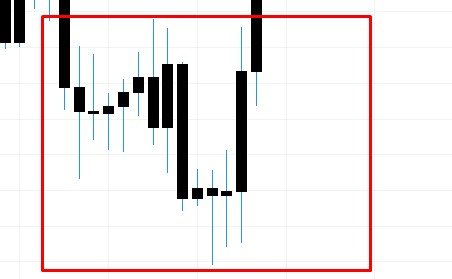
Fig2.1- USDCAD resistance zone
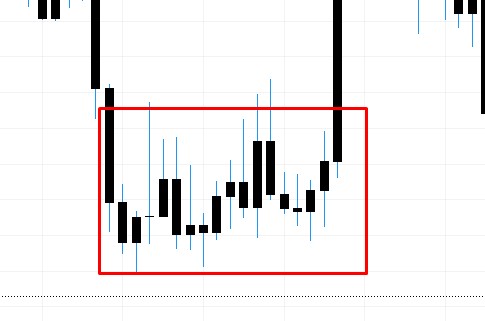
Fig2.1- USDCAD resistance zone