Timeframes Unveiled USDCAD
I break down each interval (30min to 1Day) to help navigate short term shifts and long-term trends.
Short-term Insight: The 30-Min & 1H Chart
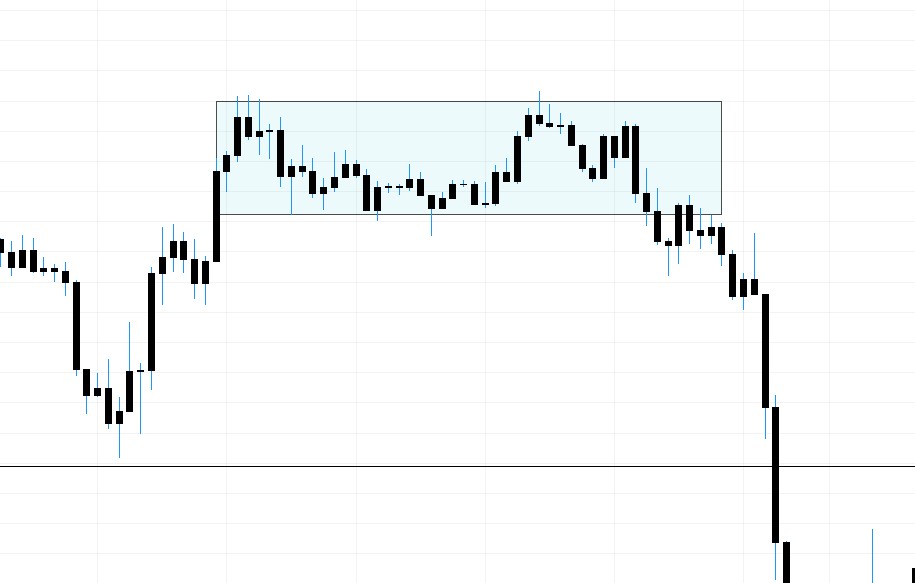
Fig2.1- USDCAD 30min chart
In shorter timeframes like 30 minutes and 1 hour, it's advisable to wait for a sideways market, akin to what's illustrated in Fig2.1. Despite the overall bearish trend (which you can confirm by enabling the line chart on the 4-hour or daily timeframe), identifying periods of sideways movement can be opportune for strategic decision-making.
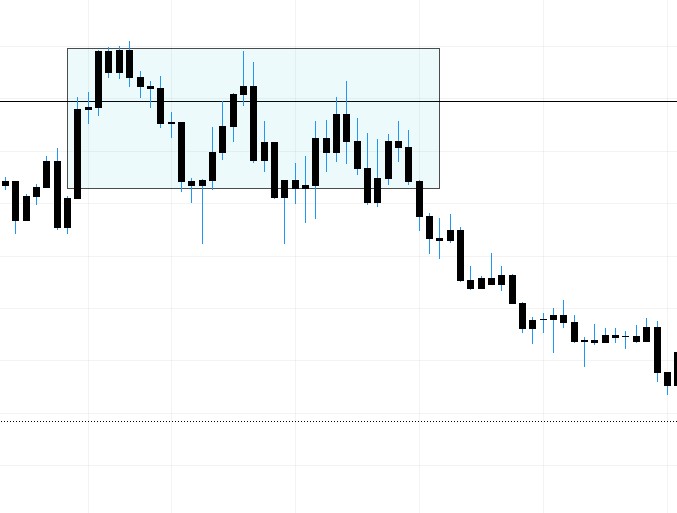
Fig2.2- USDCAD 30min chart
Absolutely, another useful tool is enabling the 40 EMA (Exponential Moving Average), which can serve as an aid in identifying potential resistance and support levels. This can add an additional layer of analysis to refine your trading decisions.
Exploring the 4-Hour Chart
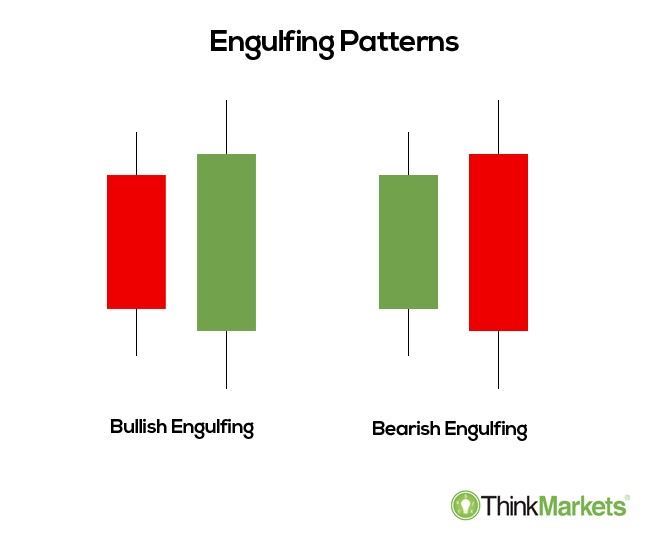
Fig2.3- Strong candlestick or engulfing
In the 4-hour timeframe, my usual strategy involves closely monitoring strong candlesticks in USDCAD. I establish resistance and support levels based on these candlestick patterns. It&apso;s noteworthy that USDCAD tends not to retest as frequently as GJ does. USDCAD has a tendency to produce fakeouts, particularly during periods of sideways movement. Therefore, when planning to take trades in the 4-hour chart, I recommend being on the lookout for strong candlesticks as they can provide more reliable signals in the context of USDCAD&apso;s behavior.
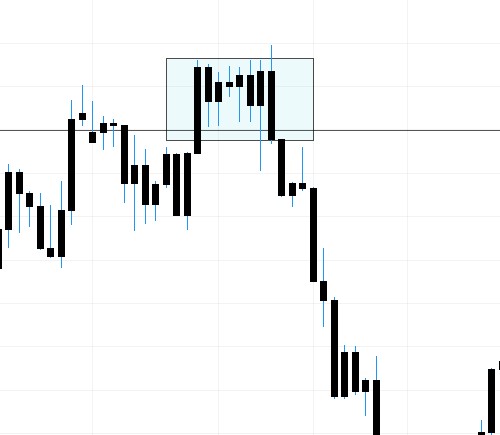
Fig2.4- USDCAD 4h chart
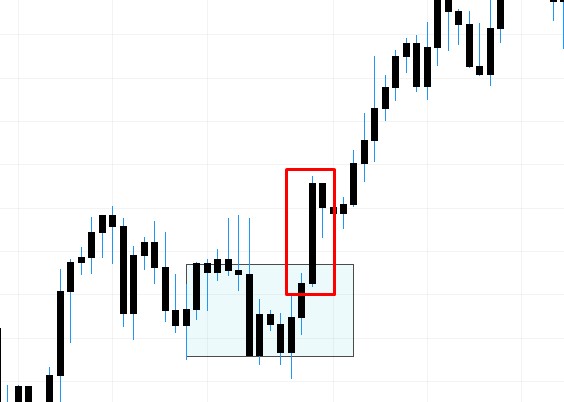
Fig2.5- USDCAD 4h chart entry
Decoding the 1-Day Chart
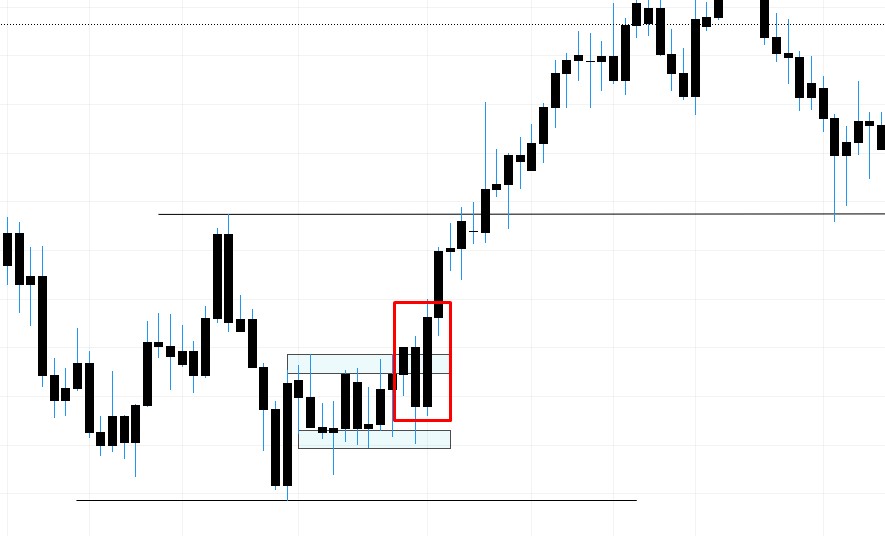
Fig2.5- USDCAD 1D chart entry
I primarily utilize the 1-day chart to see the overall trend and gauge market volume. While I rarely execute trades in the 1-day chart, I pay special attention when the market experiences low volume for consecutive days. In such instances, I wait for closure of a strong candlestick before considering any potential trades. This approach helps me navigate the market more effectively, ensuring a more robust and informed decision-making process.