Timeframes Unveiled: A Deep Dive from 30 Minutes to Daily Charts
Dive into the world of trading timeframes in 'Timeframes Unveiled.' From quick 30-minute snapshots to the broader daily view, I break down each interval to help navigate short-term shifts and long-term trends.
Short-term Insight: The 30-Min & 1H Chart
In the this timeframe, my strategy is quite simple: stick with the trend and candlestick patterns.
In Fig 1.1, I am continuing with the previous resistance, providing numerous entry points. Based on your style, you can choose your entry.
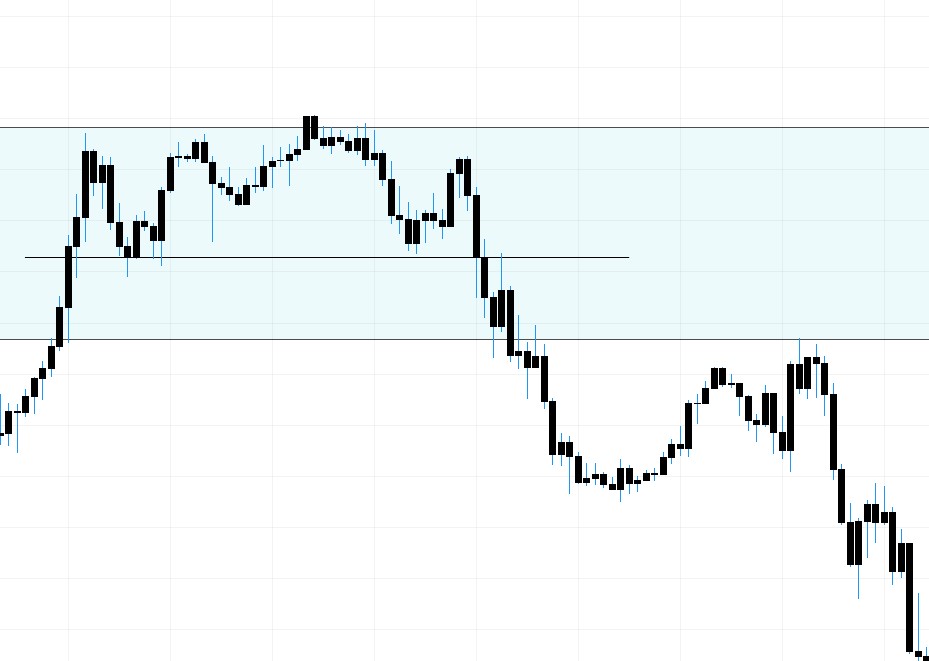
Fig1.1- 30min chart entry
For me, I am going to take a position on the first retest.
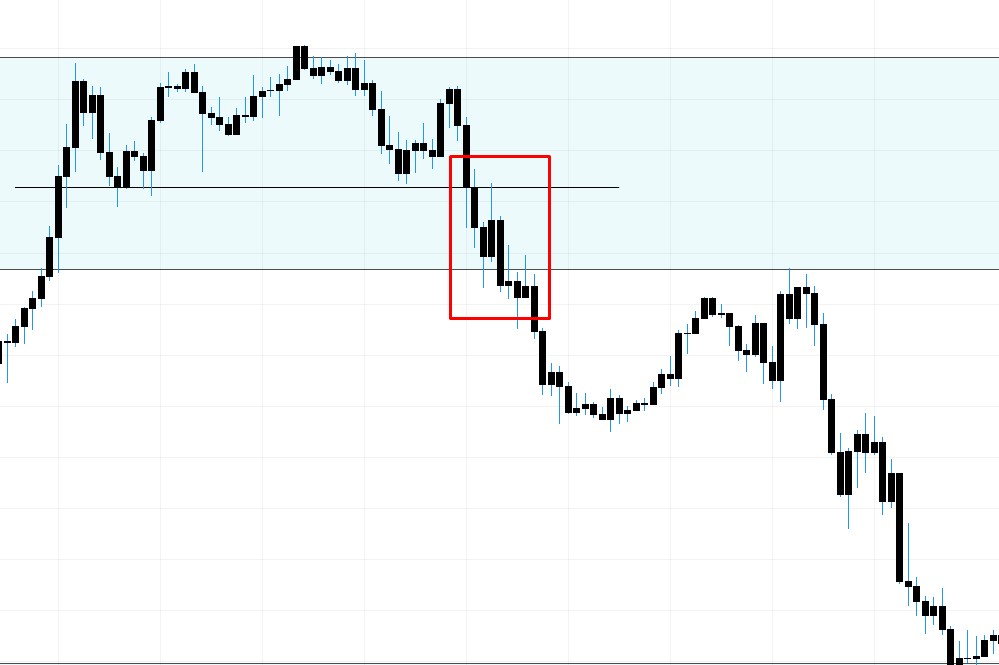
Fig1.2- My entry
4 Hours Unfolded: Exploring the 4-Hour Chart
In the 4-hour chart, there are two things I do before taking a position. The very first is a retest. If the market is retesting the resistance or support and moving in the direction of the trend, the next step is enabling the 40 EMA indicator on your chart.
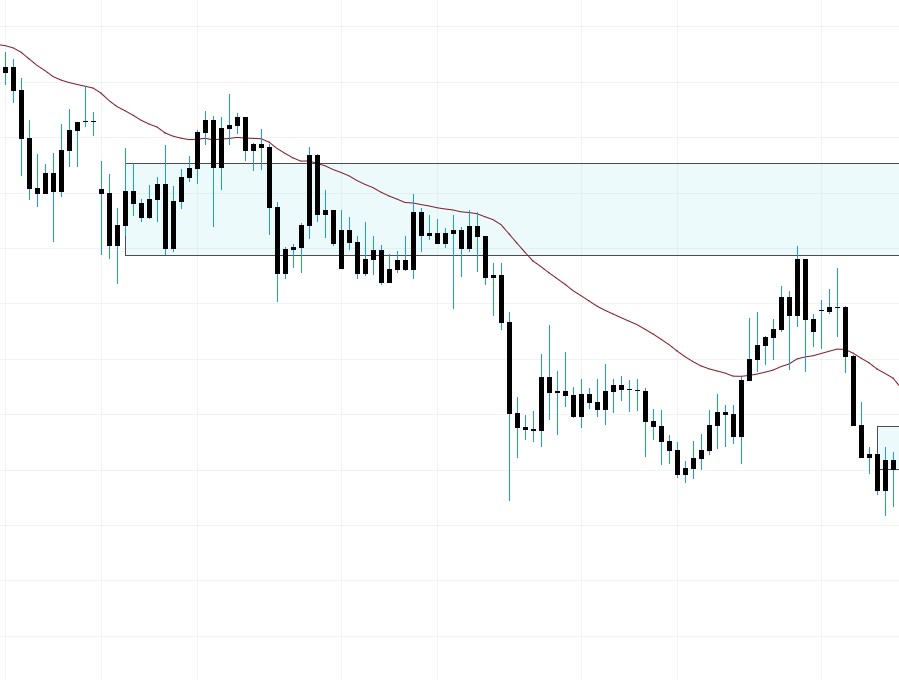
Fig1.3- 40 EMA working as resistance
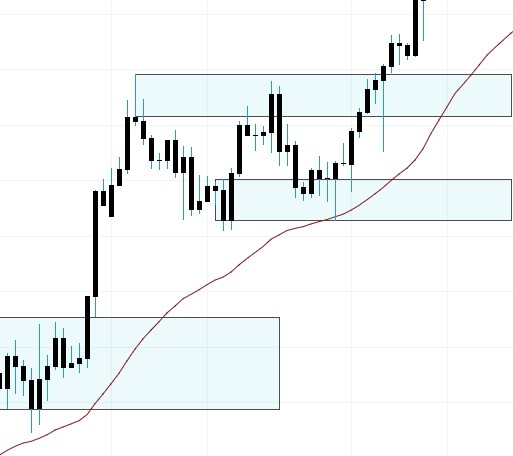
Fig1.3- 40 EMA working as support
As you can see in the 4-hour chart, the 40 EMA works as resistance or support. My entry will be when market touch 40 EMA So, using a combination of these two techniques, you can make trades in the 4-hour timeframe.
Daily Dynamics: Decoding the 1-Day Chart
Typically, I prefer utilizing the daily chart to assess the overall direction of the market. As part of my daily routine, I make it a point to examine the candlestick pattern from the preceding day, specifically during the active Japanese market hours at 06:30 IST.
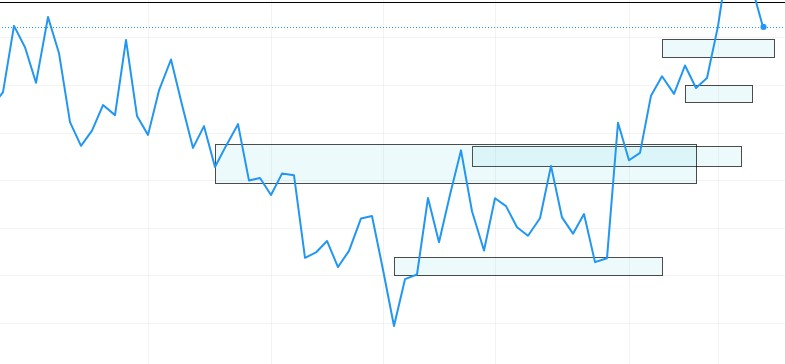
Fig1.4- Checking trend using line chart
This habitual analysis serves as a crucial element in my strategy, aiding me in identifying and understanding the prevailing trend in the market.