Trade With Volume
Trading with volume involves analyzing the number of shares or contracts traded in a market. It helps to gauge the strength or weakness of a price movement, aiding in decision-making during trades.
Knowing when the market is active and when it is not can make a lot of difference. Starting with the Japanese market opening builds the foundation for the rest of the day.
If during the Japanese market opening, the candlestick breaks the resistance or support, it is a very good sign that the market may trade with high volume in the next market opening (GB). But be very careful about the type of candlestick that breaks the resistance or support; it can make a lot of difference.
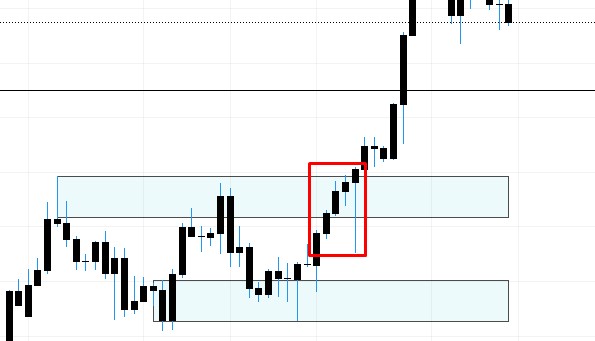
Fig1.1- 4h chart- Japanese market opening
In Fig 1.1, during the Japanese high-volume market time, the candlestick is merely testing the resistance. However, during the GB opening, there is a significant hammer candle. That's where I am entering. This is due to two reasons: first, the market is in an uptrend, and second, there is a hammer candlestick retesting the resistance.
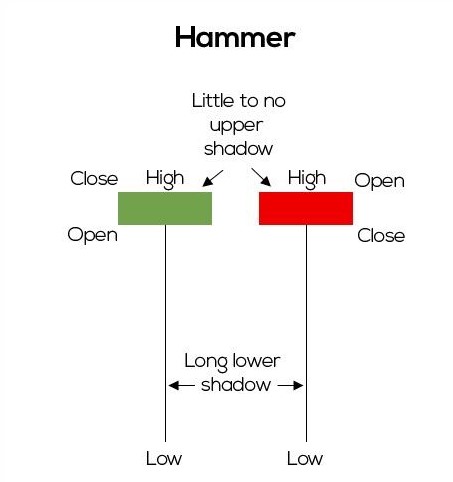
Fig1.2- Hammer candlestick
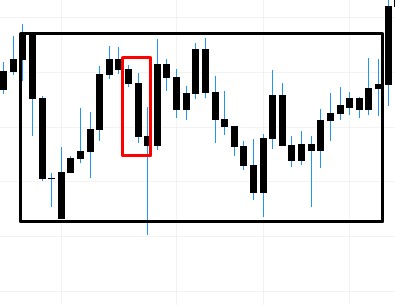
Fig1.3- 4h chart- Japanese market no opening
In Fig 1.3, the candlestick at 11:30 IST closes with good volume, but the market direction is sideways. It is always better to trade in a bull or bear market; sideways markets are harder to predict.
The opening of the GB and USA markets is also crucial, especially during the USA market opening where there is a lot of movement.
Important times to note are 06:30, 10:30, 14:30, 16:30, 18:30, 19:30, and 22:30 IST. During these time market is most liquid.
06:30-10:30 IST- Japanese market
14:30-16:30 IST- Europe market
18:30-19:30 IST- USA market
Here, I am mentioning summer time.