Understanding Zone in GBPJPY
Zones play a significant role in forex. Every currency or stock has its major resistance and support levels. Understanding these levels allows traders to make informed decisions. The unique aspect of GJ is its tendency to retest zones multiple times, at least twice.
Understanding major zones is crucial when entering any trade. Let's begin with simple yet essential zones applicable to any stock or currency. In charts, zones that conclude with a zero hold significance. This is because the human mind has a natural affinity for numbers that end with zero and, there's a certain visual appeal to it.
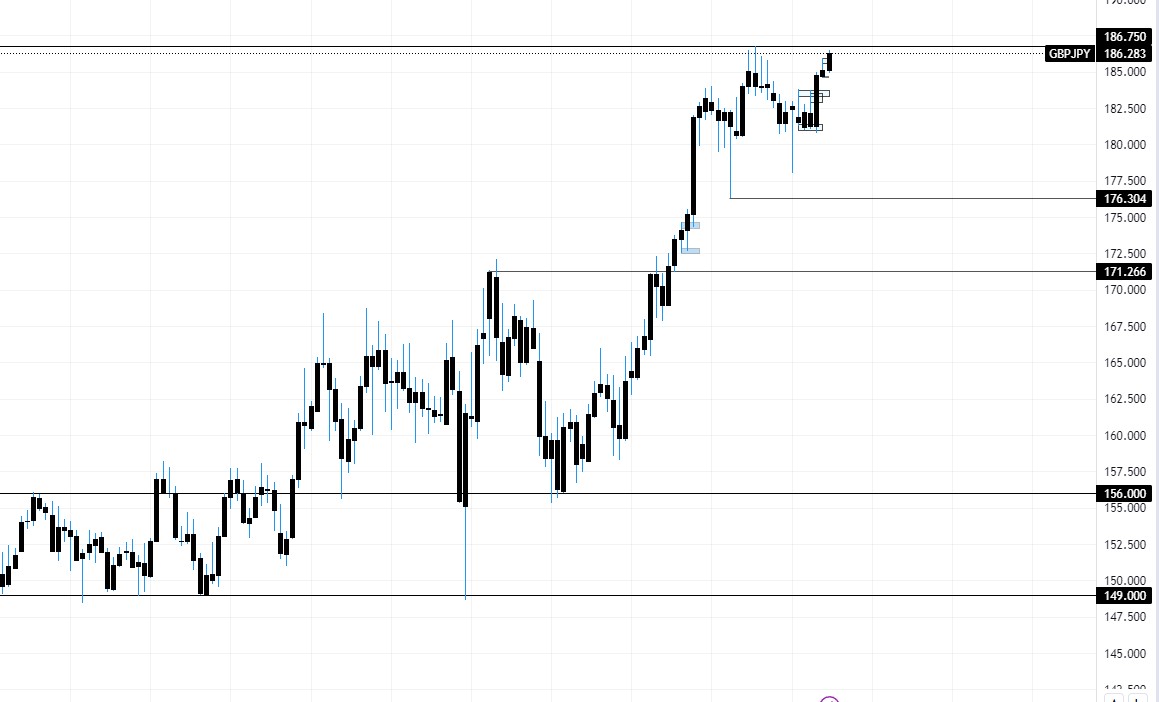
Fig1.1-GBPJPY zone
Here are some important zone to note for weekly charts-149.00, 156.00, 171.00, 186.75, and 192.42.
I like to represent zones using lines as zones, which is more useful in 1-month, 1-week, and 1-day charts. The other way is by using rectangles, which is useful in smaller time phases such as 4 hours, 1 hour, and so on.
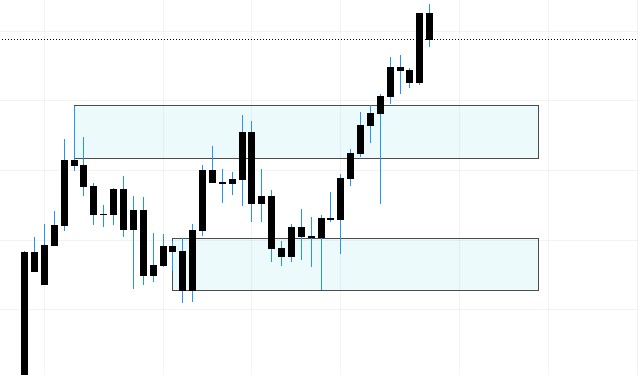
Fig1.2- 4h chart by reactangle way
Every weekend, I make changes to my charts if necessary. In TradingView, you can toggle between candlestick charts, line charts, or any other chart type of your choice. To mark important zones on the chart, I switch to line charts. This helps me identify trends, resistance, and support more effectively.
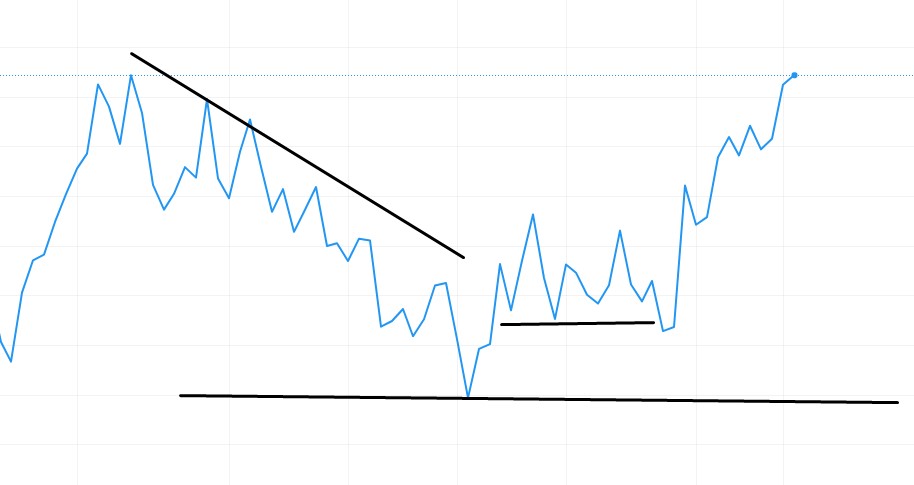
Fig1.3- 1D line chart
By this way you can identify zones.